The Index strategy is based on qualitative and quantitative inputs, including economic data and interpretations of government policy. Asset allocation guardrails include 50% – 200% allocation relative to the benchmark for credit, duration, and structure/mortgage weight. A high-conviction exposure to more speculative or diversifying positions is constrained to 0% – 20%.
The characteristics below reflect how we would best position a portfolio of fixed-income ETFs to achieve maximum total return over a comparable baseline neutral portfolio of fixed-income securities (benchmark).
Relative Positioning
Duration
90% Relative Underweight
Yield Curve
Slightly Bulleted
Corporate Credit
Underweight
Securitized
Overweight
Conviction
10% EM Local Debt
Rationale
90% Duration
In April, the committee shifted from neutral duration to underweight.
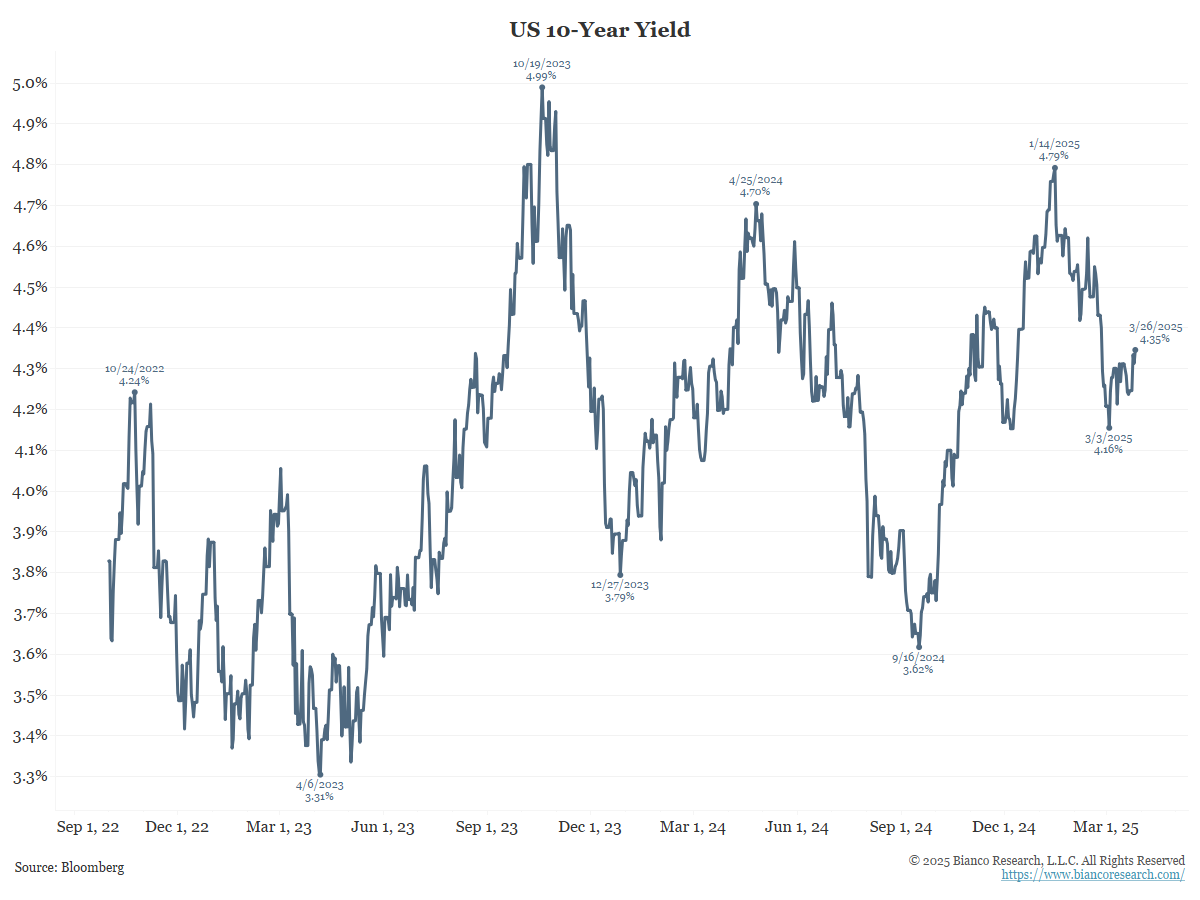
The Index now has a 90% relative duration position compared to its benchmark, positioning for a rise in interest rates.
The committee expects the economy and inflation to remain stronger than expected. Recent talk of recession, tariffs, and 10% stock market corrections should have produced lower rates. Yet the 10-year yield, 4.30% as of this writing, is well above last September’s low of 3.60%. Yields did not fall on this news. We believe this bond-bullish news will soon give way to bond-bearish news of recovering stocks, a stronger economy, and sticky inflation.
Slightly Bulleted Curve Position
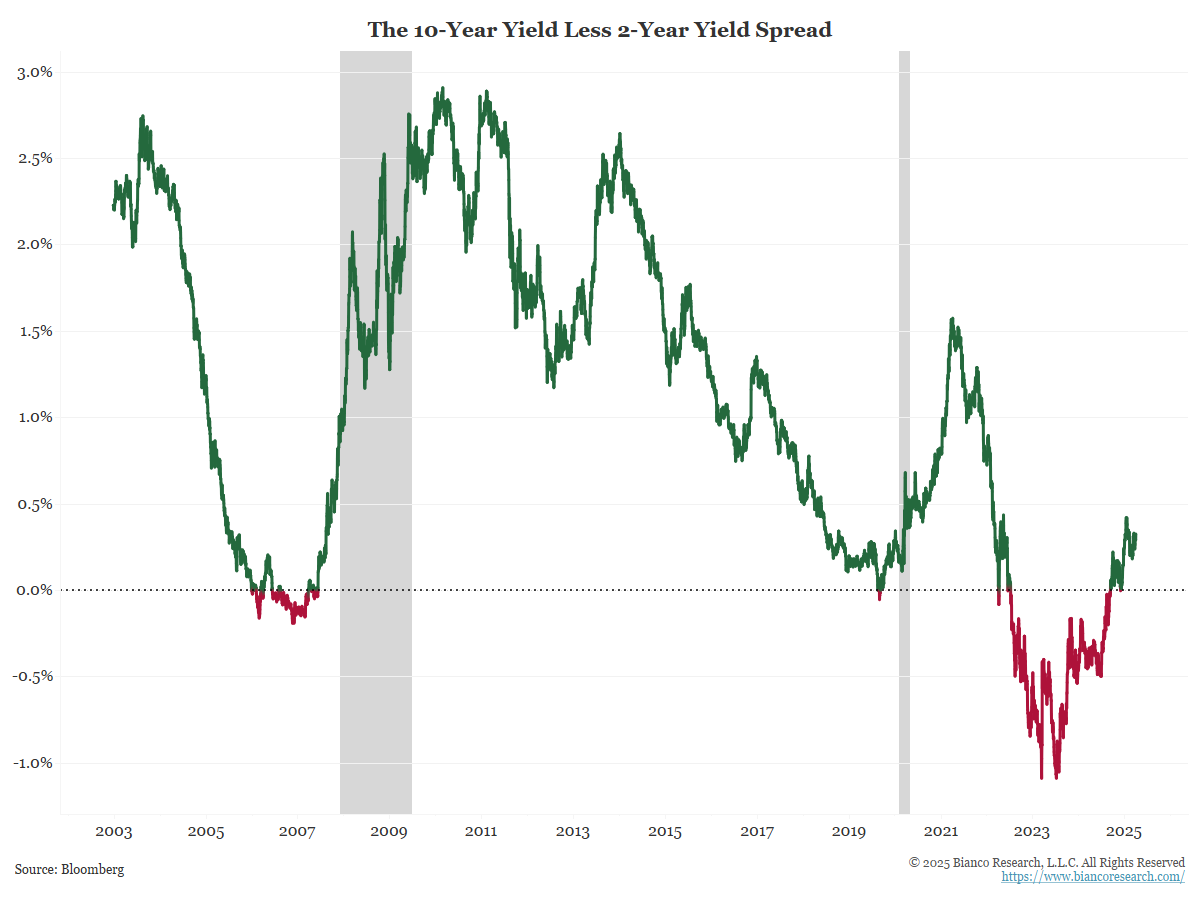
The Index holds a bulleted curve position relative to the benchmark. This means it is overweight in the middle of the yield curve. This position will benefit from the yield curve steepening.
Should the economy recover and inflation stay sticky, we expect long-term yields to rise faster than short-term yields and steepen the yield curve.
70% Underweight Credit
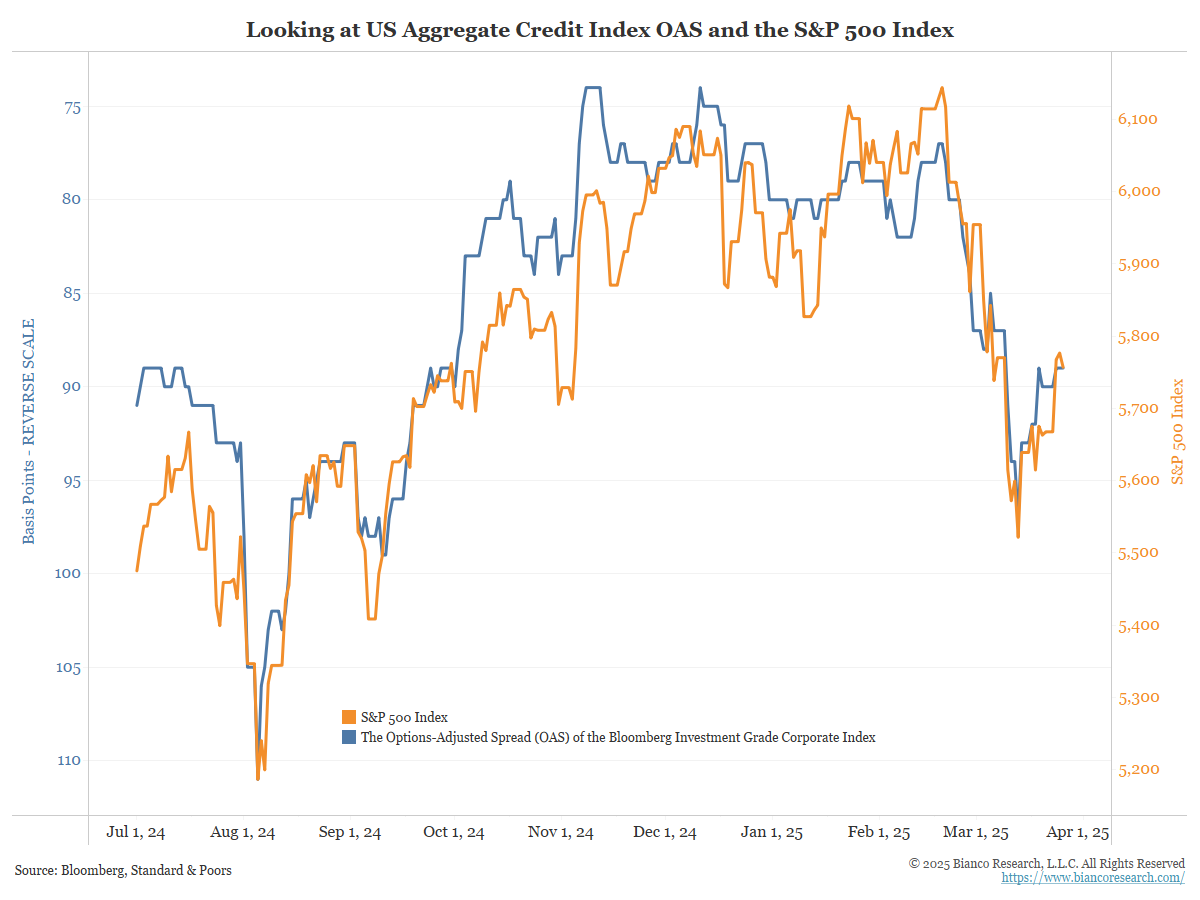
The Index is 70% weighted in corporate bonds relative to the benchmark given strong corporate bond issuance (more supply) and high valuations in the equity market.
Relative corporate bond positions are correlated to stock market movements. Given the high valuations, even after the 10% stock market correction, any oversold rebound in corporate bonds following stocks higher should be limited.
150% Overweight MBS
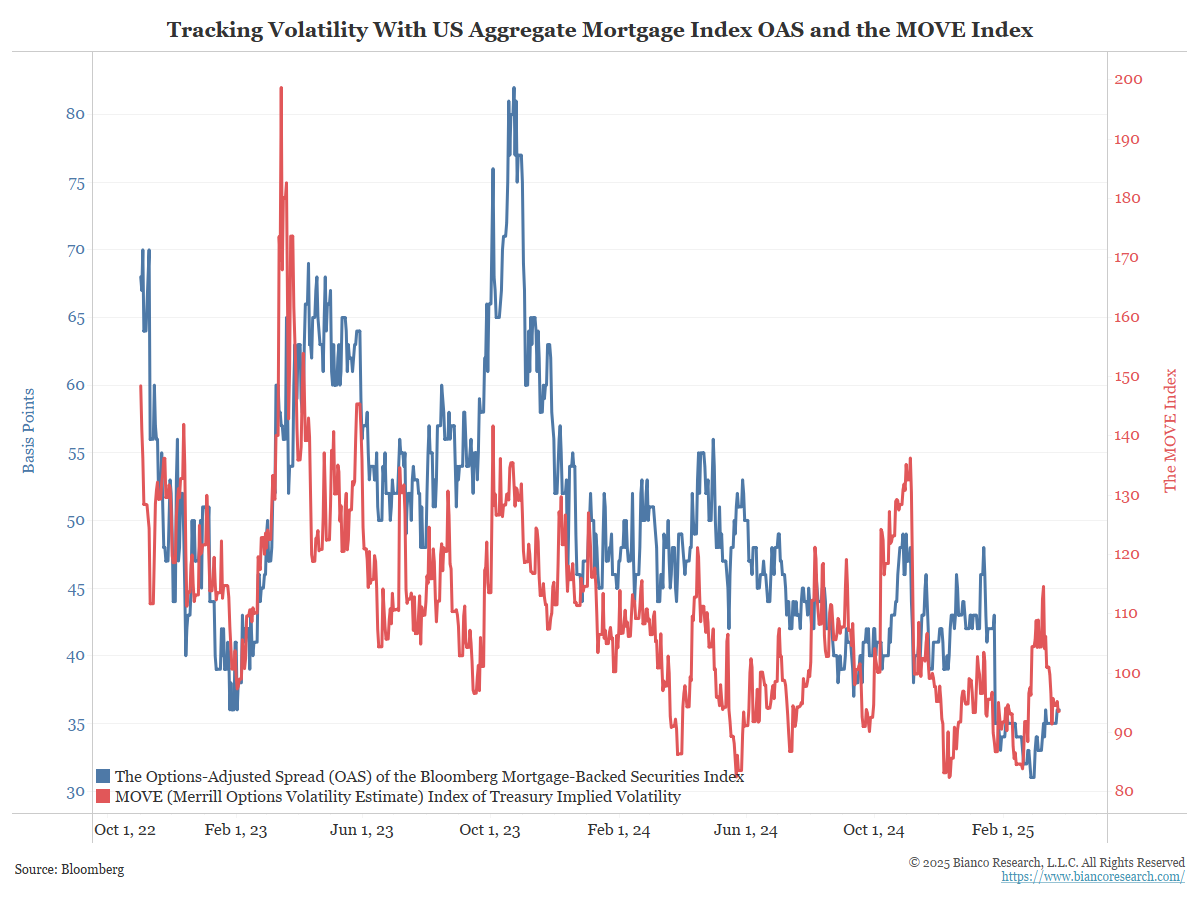
The committee decided to move further overweight mortgage-backed securities (MBS) from 130% to 150% of the benchmark allocation.
MBS yields are well above Treasury yields and comparable to investment-grade corporate bond yields.
Rising Treasury yields will benefit MBS by slowing the rate of refinancing, keeping MBS yields high, and limiting any price declines.
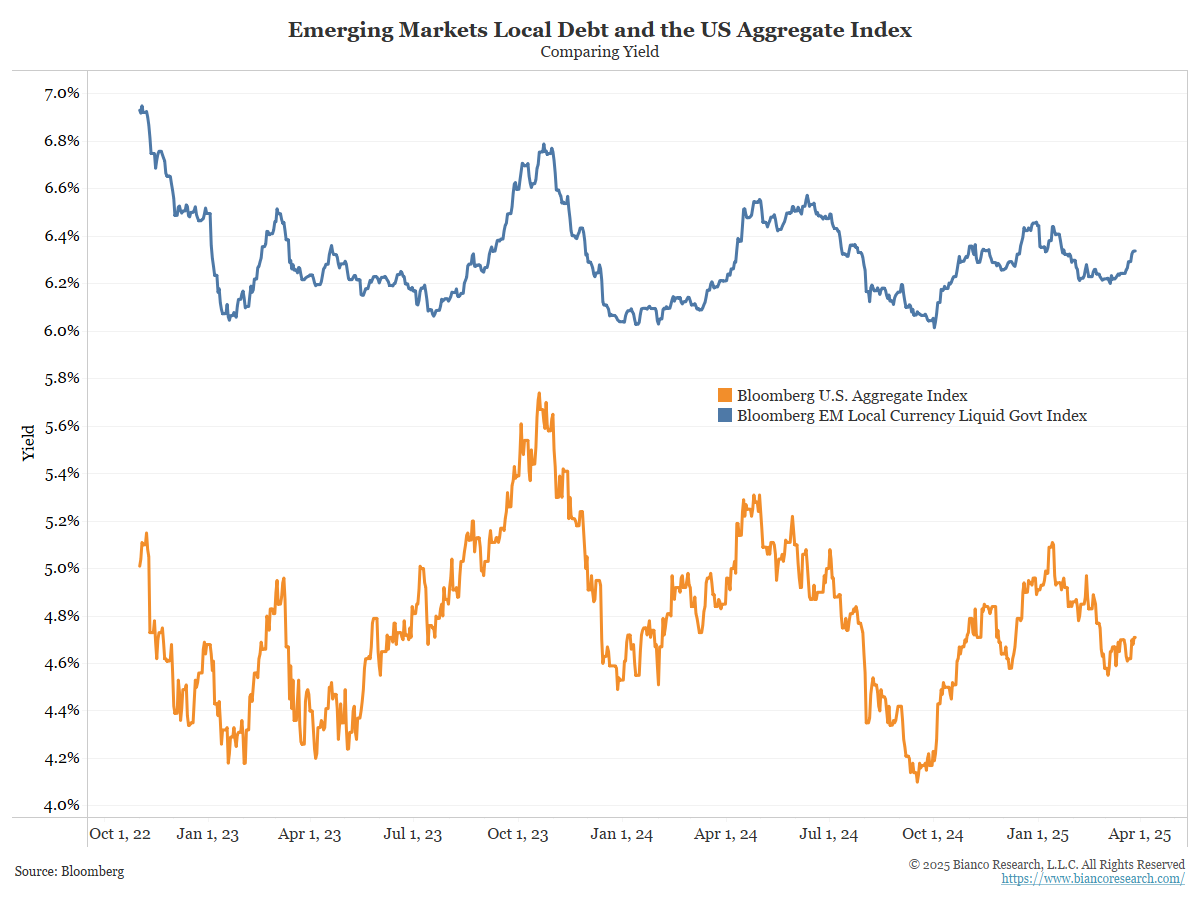
10% Emerging Markets Local Debt
In February 2025, the committee allocated 20% to senior loans. The committee decided to exit this position in favor of a 10% allocation to emerging market local debt.
This position offers a higher yield than domestic corporate bonds and will benefit from a weakening dollar relative to these currencies. This has been the case so far this year, and we expect it to continue as such.
Allocation Changes
| Name | April 2025 | March 2025 |
|---|---|---|
| iShares MBS ETF | 40.50 | 35.60 |
| iShares 3-7 Year Treasury Bond ETF | 10.95 | 6.50 |
| iShares 7-10 Year Treasury Bond ETF | 10.75 | 11.70 |
| WisdomTree Emerging Markets Local Debt Fund | 10.00 | 0.00 |
| Vanguard Short-Term Corporate Bond ETF | 9.00 | 0.00 |
| Schwab Short-Term U.S. Treasury ETF | 6.50 | 0.00 |
| Vanguard Intermediate-Term Corporate Bond ETF | 5.80 | 5.60 |
| iShares BBB Rated Corporate Bond ETF | 4.50 | 4.50 |
| Vanguard Long-Term Corporate Bond ETF | 1.00 | 11.10 |
| Schwab Long-Term U.S. Treasury ETF | 1.00 | 5.00 |
| Invesco Senior Loan ETF | 0.00 | 20.00 |