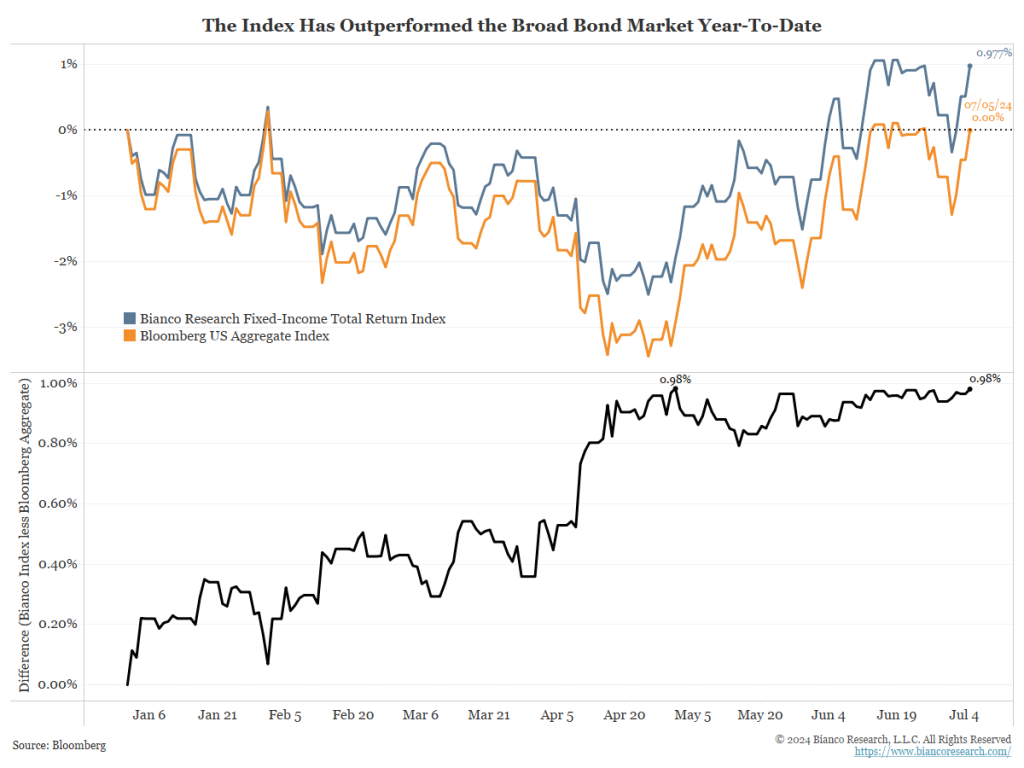
As the year’s first half drew to a close, the Bianco Research Fixed-Income Total Return Index (Bloomberg: BTRINDX) finished 98 basis points better than the Bloomberg US Aggregate Index.
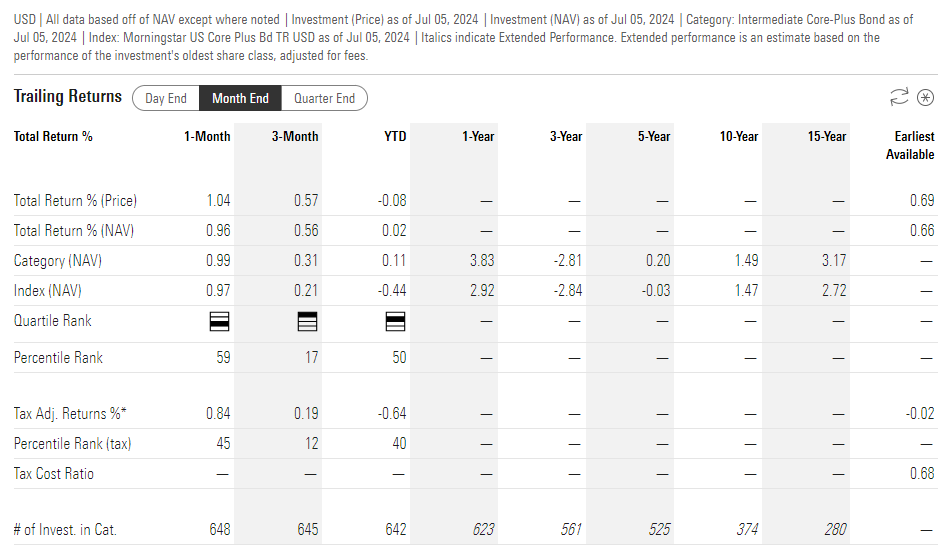
The ETF that tracks our Index, the WisdomTree Bianco Fund (symbol: WTBN), is in the Morningstar Intermediate Core-Plus Bond category. Year-to-date, its performance ranks in the second quartile and was a first-quartile performer in Q2.
Here is a closer look at the Morningstar category performance and ranking.
The primary factors driving our outperformance during the first half of 2024 were the relative duration underweight versus our benchmark index through the end of April, an out-of-index position of as much as 20% in short-duration Treasury Inflation-Protected Securities (TIPS), and a relative underweight in Mortgage-Backed Securities (MBS) through May.
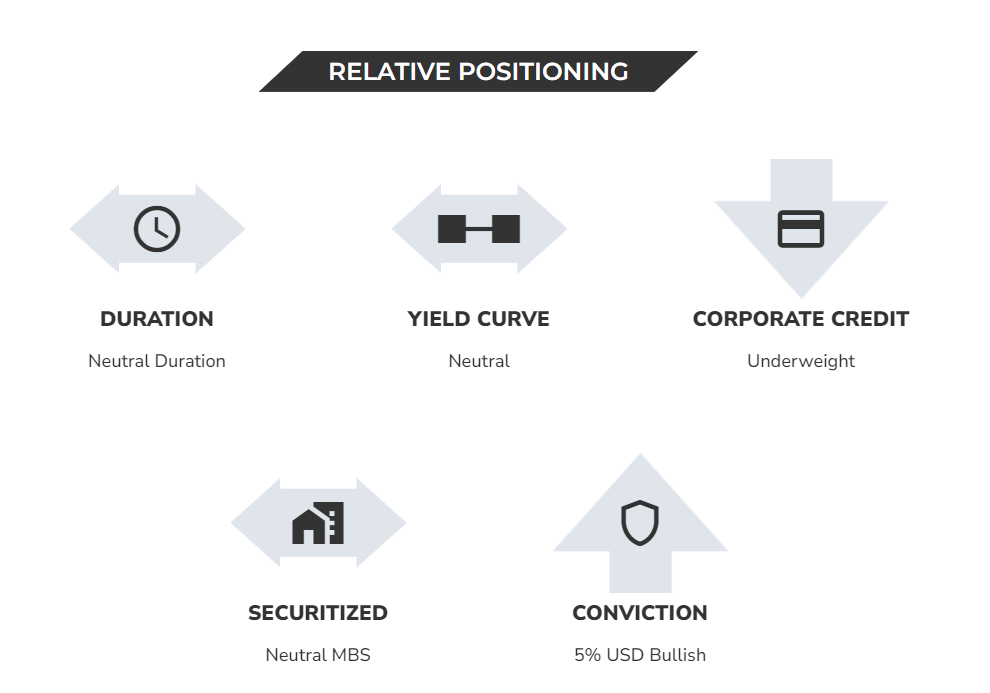
Currently, however, all our positions are neutral with a 5% out-of-index position in the US dollar. More details about our positioning can be found on our Index Update page.
So, why are we currently holding positions that look like an index fund?
What Is Neutral?
Chicago Federal Reserve President Austan Goolsbee spoke last week in Sintra, Portugal (our emphasis):
“We got to this rate when inflation was over 4%, and inflation is now down close to 2.5%, so if you sit with the rate somewhere while inflation goes down you’re tightening. The reason that you would want to tighten is if you think that you’re not on a path to 2%,” said Goolsbee, who will vote on the Fed’s July policy decision as an alternate member of the Federal Open Market Committee.
The chief economist of Moody’s Analytics, Mark Zandi, had similar thoughts last week.
These thoughts assume some degree of certainty in regards to where the “neutral” interest rate is. This is the interest rate that neither stimulates nor restricts the economy. Do we know where this rate is? The Fed thinks it does.
Every quarter, the Fed publishes its Summary of Economic Projections (SEP). The chart below shows the forecasts for the fed funds rate as of the June 12 SEP. Each blue dot represents one of the 19 FOMC members’ forecasts. The orange line shows the median.
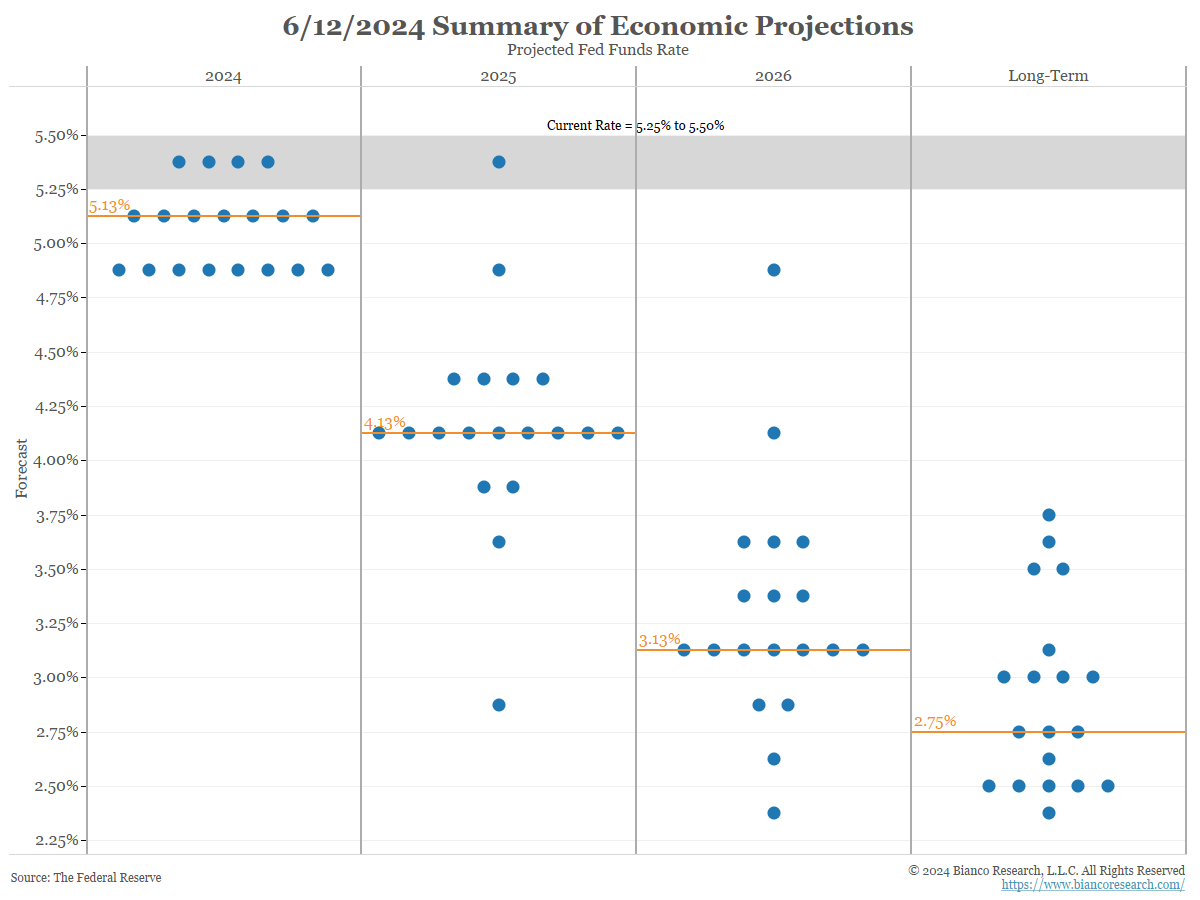
The 2024 and 2025 medians receive most of the financial media attention. They show Fed officials expect a 25-basis-point rate cut in 2024 and four more 25-basis-point cuts in 2025.
However, we would argue the long-term dots and their median are now the most important part of this forecast. This is the Fed’s estimate of the neutral rate.
The next chart shows the FOMC’s long-term projections back to 2019.
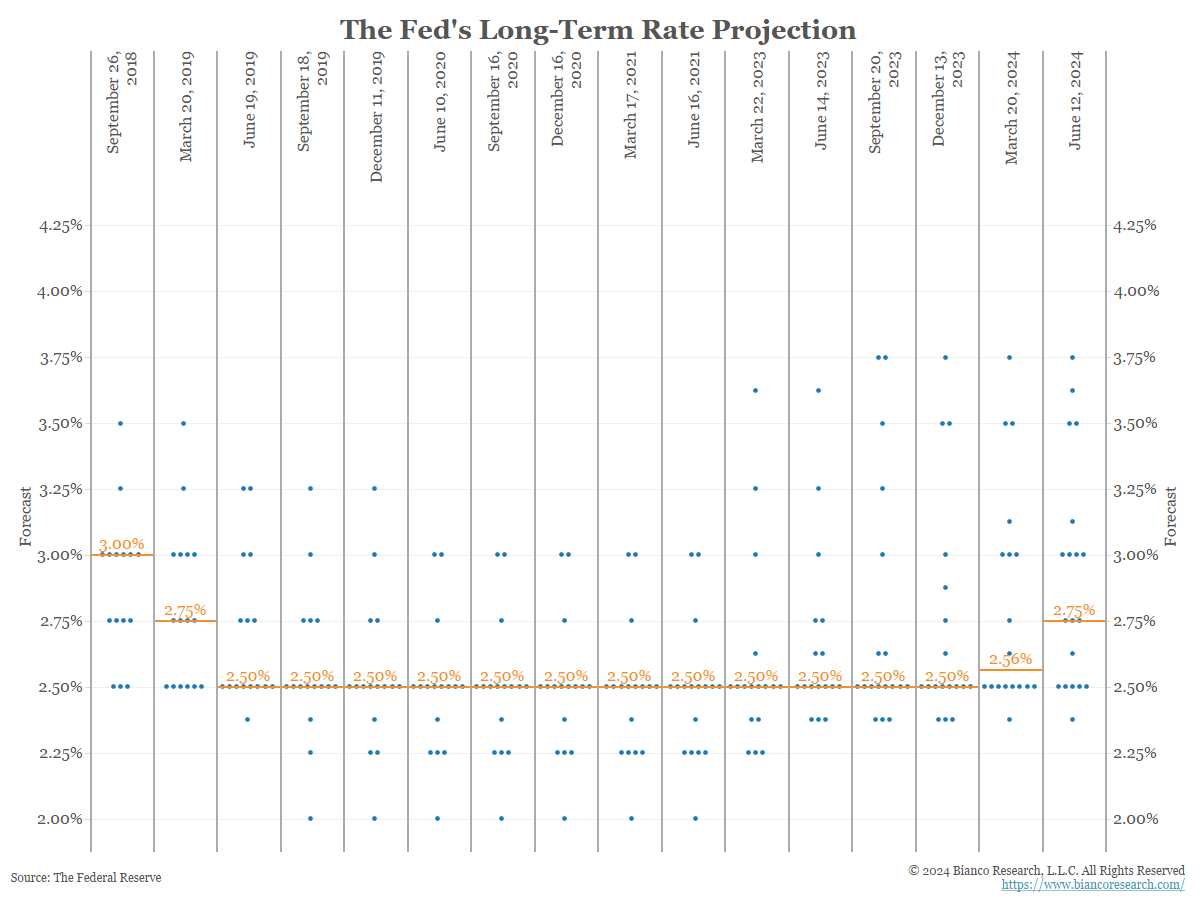
The median (orange line above) long-term rate was 2.5% for years. So, it was understandable that this rate never received attention. It was always the same. But now it is slowly starting to move higher.
The market also has a view about the neutral rate. The next chart starts on March 16, 2022, when the Fed started hiking rates.
- The blue line is derived from the fed funds futures contracts between one and four years out and plots the lowest implied yield (even if they switch from contract to contract).
- The green line is a deconstruction of the forward swaps curve showing the 5-year yield expected in 5 years.
- The orange line is the median of the Fed’s long-run dots, the same as the orange lines above.
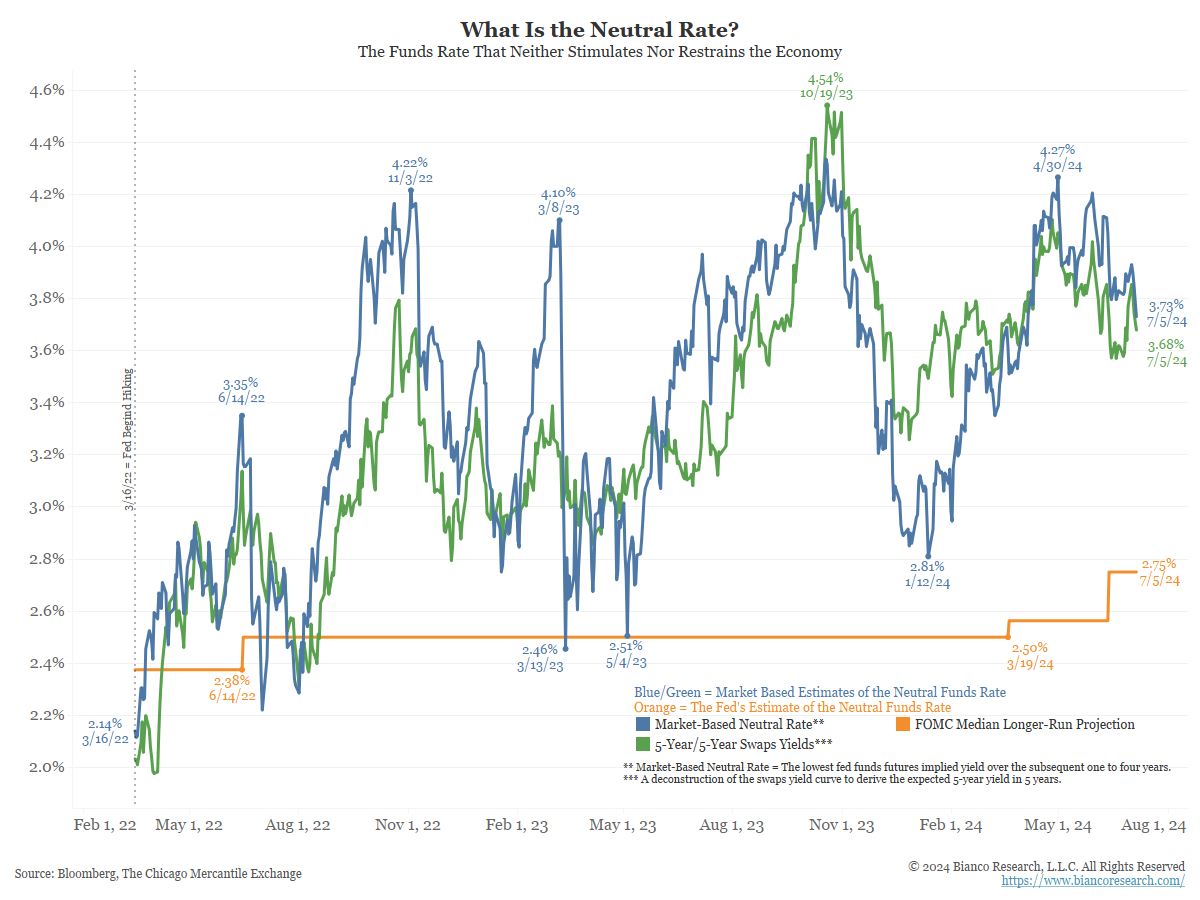
Currently, the two market metrics of the neutral interest rate (blue and green) are relatively close at roughly 3.70%. Just two months ago, these metrics were near 4.25%. This is well above the Fed’s estimate of neutral at 2.75% (orange).
Why does this matter? The bottom panel shows how many 25 basis points it will take to return to neutral.
- The red line is the number of cuts needed according to the Fed’s estimate of neutral. It subtracts the current target funds rate (gray line, top panel) from the Fed’s estimate of neutral (orange)
- The green line is the number of cuts needed according to the market’s estimate of the neutral. It subtracts the current target funds rate (gray line, top panel) from the market’s estimate of neutral (blue)
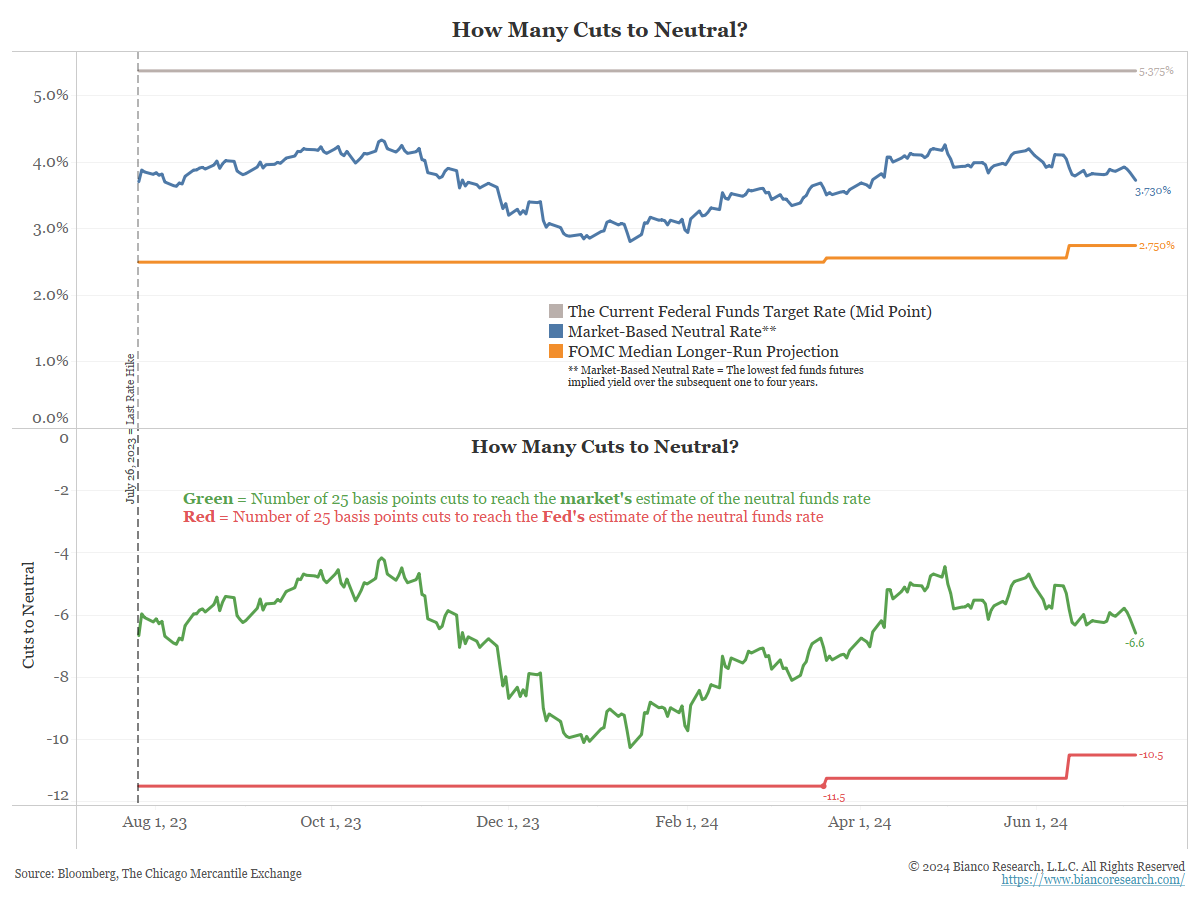
As the bottom panel above shows, the Fed’s neutral estimate of 2.75% means it has to cut rates 10.5 times in 25 basis point increments to return to neutral (red line). However, the market estimates that the Fed only needs 6.6 cuts to get to neutral (green line).
Lots of Work to Do
Why has the Fed been so insistent on rate cuts this year? With neutral near 2.75%, they believe they have a lot of cutting to do once they start. This is why people like Austan Goolsbee and Mark Zandi want to get started sooner rather than later.
The market, however, is not so sure, which is why their estimate of neutral (blue and green two charts above) is much higher, at 3.70%, and recently over 4%. This reflects different market assumptions between the Fed and the market. The biggest difference is what the “real” interest rate is neutral. Real interest rate are the “nominal” interest rate after subtracting the inflation rate.
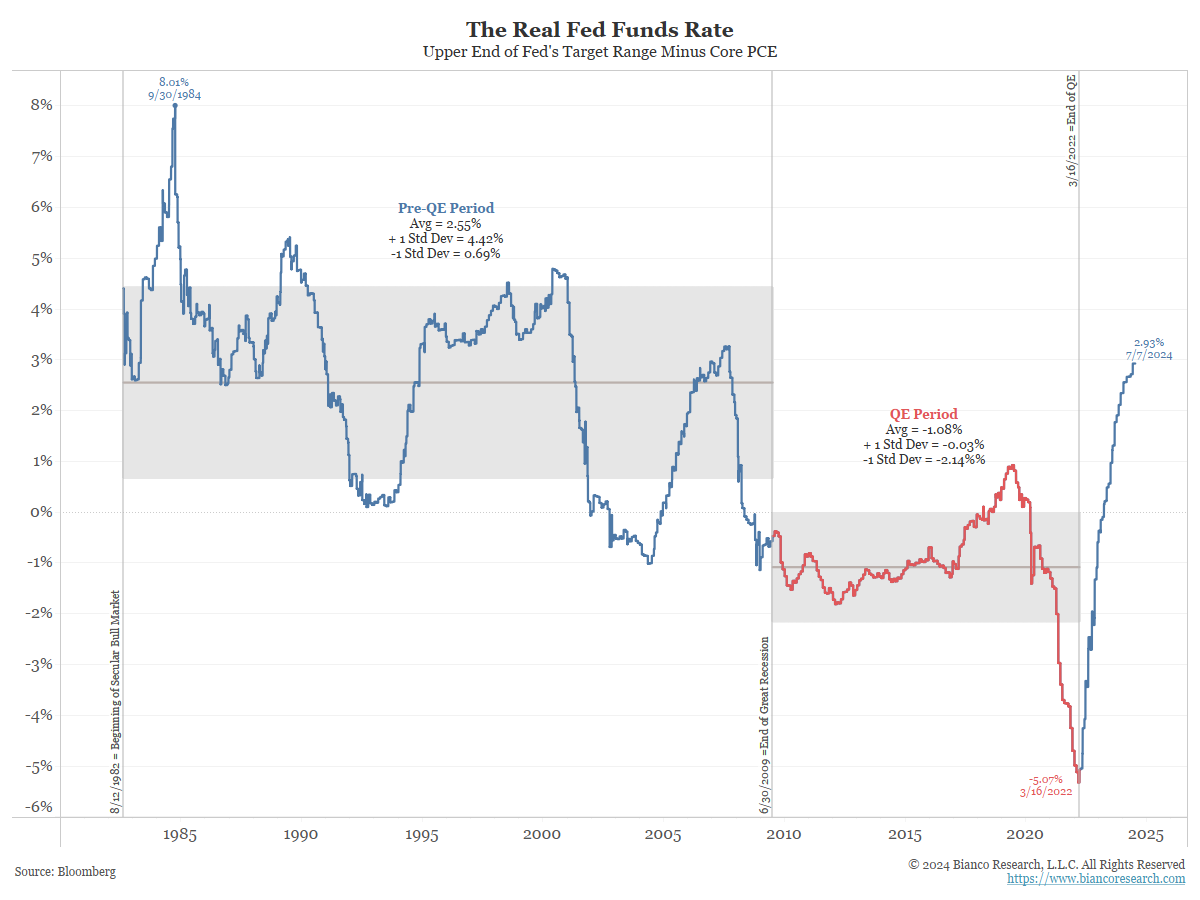
The next chart shows the real fed funds rate, or the nominal fed funds rate subtracting core PCE, the Fed’s preferred measure of inflation.
The latest level is 2.93%. Is this a high level restricting the economy?
The Fed thinks 2.93% is too high. This is because the Fed is anchored to the post-financial crisis (2009) period, or the red part of the chart below. During this period, real rates averaged negative 1.08%. So, the current level of positive 2.93% must seem like a punishing level of interest rates to them. Hence, there are constant calls to start cutting the funds rate sooner rather than later.
However, we believe the market is now looking at the post-financial crisis as an aberration, and the pre-financial crisis period, the blue part of the line to the left below, is closer to neutral. During this period, the real funds rate averaged a positive 2.55%, not far from the current level of positive 2.93%. Hence, the market is far more sanguine about how restrictive the current real rates are for the economy. The stock market continuing to power to new heights supports this idea.
Conclusion
The Fed thinks it is highly restrictive now, while the market thinks it is far less restrictive. As long as this divergence remains, holding rates steady satisfies the market more than the Fed, as the market thinks it is closer to neutral.
However, should the Fed interpret the economic and inflation data as weak enough to cut, the risk is a toxic reaction to an impending policy mistake of cutting too early and by too much.
This puts the bond market at an inflection point as we wait to see whether the Fed is ready to initiate a rate cut. To use a metaphor, it’s like the top of a roller coaster when everything stops. We believe we are at that point now. But the coaster can go one of several tracks for the rest of the ride. So, we are broadly holding positive and relatively neutral, seeking clarity on the coaster’s tracks that will start the next thrill ride.
We suspect we’ll have that clarity before the end of the summer.