The Fed will begin cutting rates later this month. What should we expect, and what will follow? And how should we be positioned for it?
What To Expect
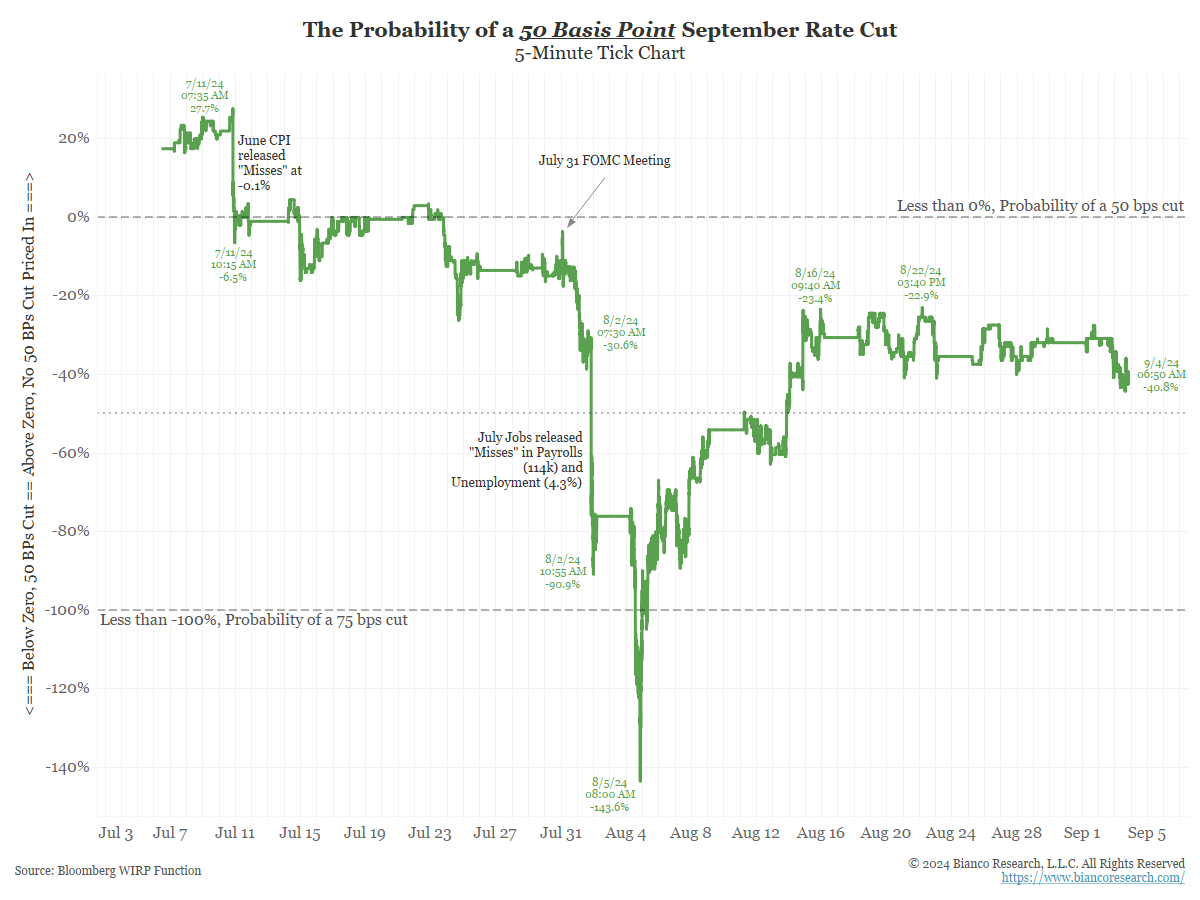
The next Fed meeting is September 18. As of this writing (September 4), the market is pricing a 41% probability of a 50-basis cut or a 59% probability of a 25-basis cut.
This cut is expected to start a rate-cutting campaign.
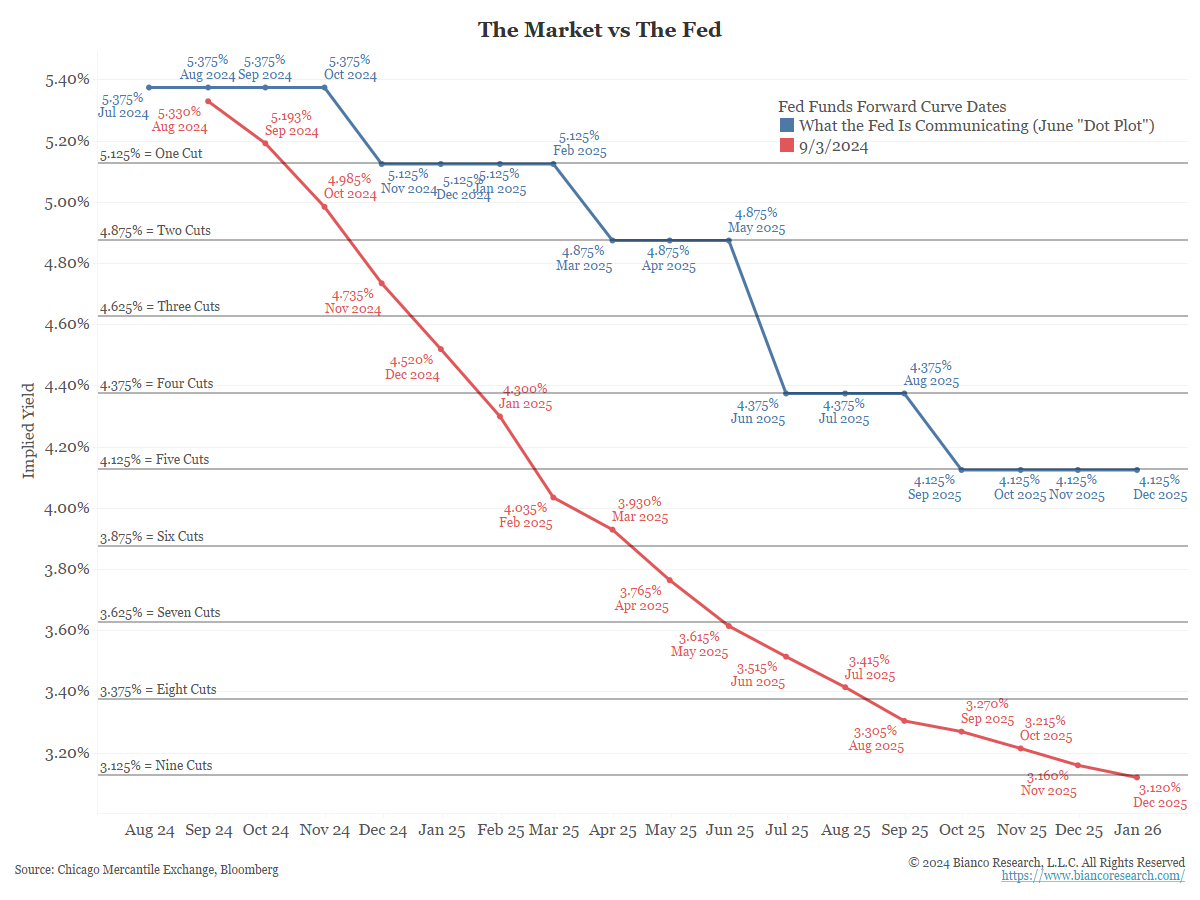
The blue line below shows the Fed’s funds rate projections from the June Summary of Economic Projections. By December 2025, they expected the funds rate to be 4.125%, with five 25-basis-point cuts.
The red line shows what the market is currently pricing in. The market expects the funds rate to be 3.12% at the end of December 2025, with nine 25-basis-point cuts over the next 15 months.
The market expects this month’s rate cut to start an aggressive rate-cutting cycle.
So, markets and civilians are both expecting lower rates. We detailed this more in a discussion on bond bullishness: Everyone is Bullish Bonds
Why Is Everyone Bullish Bonds?
Below is a laundry list of arguments often mentioned among bond bulls:
- Real rates are too high
- Inflation has been defeated
- The economy is slowing
- Unemployment is rising
- The stock market is struggling
Yet these bullets have inherent problems that may lead to too much bond bullishness. Let’s break them down.
Real Rates
Below is the Fed’s favorite real-rate measure, the target funds rate less core PCE.
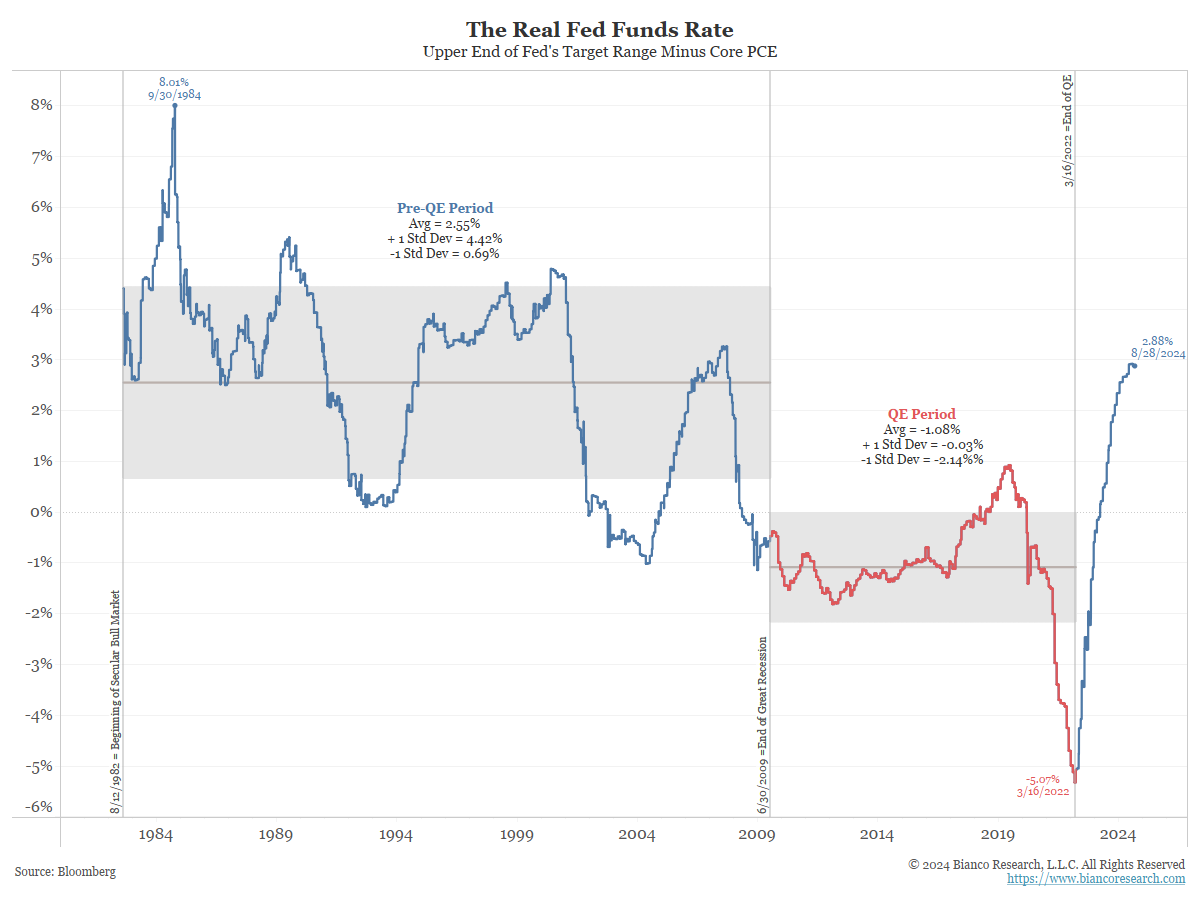
There are two ways to look at this. One is the current real rate level of 2.88%, which is the highest since 2007, which means interest rates are overly restrictive. However, this argument assumes that the post-financial crisis real-rate period, shown in red, is a “normal” period. From 2009 to 2020, the QE period, real rates averaged 1.08%.
That said, from 1982, the start of the bond bull market, to 2007, real rates averaged 2.55%. So, was the QE period the anomaly? Chairman Jay Powell repeatedly says we are not returning to zero interest rates, suggesting the QE period is indeed over. If so, what is the appropriate level of real rates? An argument can be made that it is very close to current levels, and real rates are not that restrictive.
Anticipating an argument, could the high government debt levels mean real rates should be lower? This is known as fiscal dominance, where fiscal policy dictates monetary policy. Chairman Powell also repeatedly said the Fed would not let fiscal dominance dictate momentary policy. In other words, if debt levels are too high, that is an issue for Congress to address, not the Fed to accommodate.
Inflation Has Been Defeated
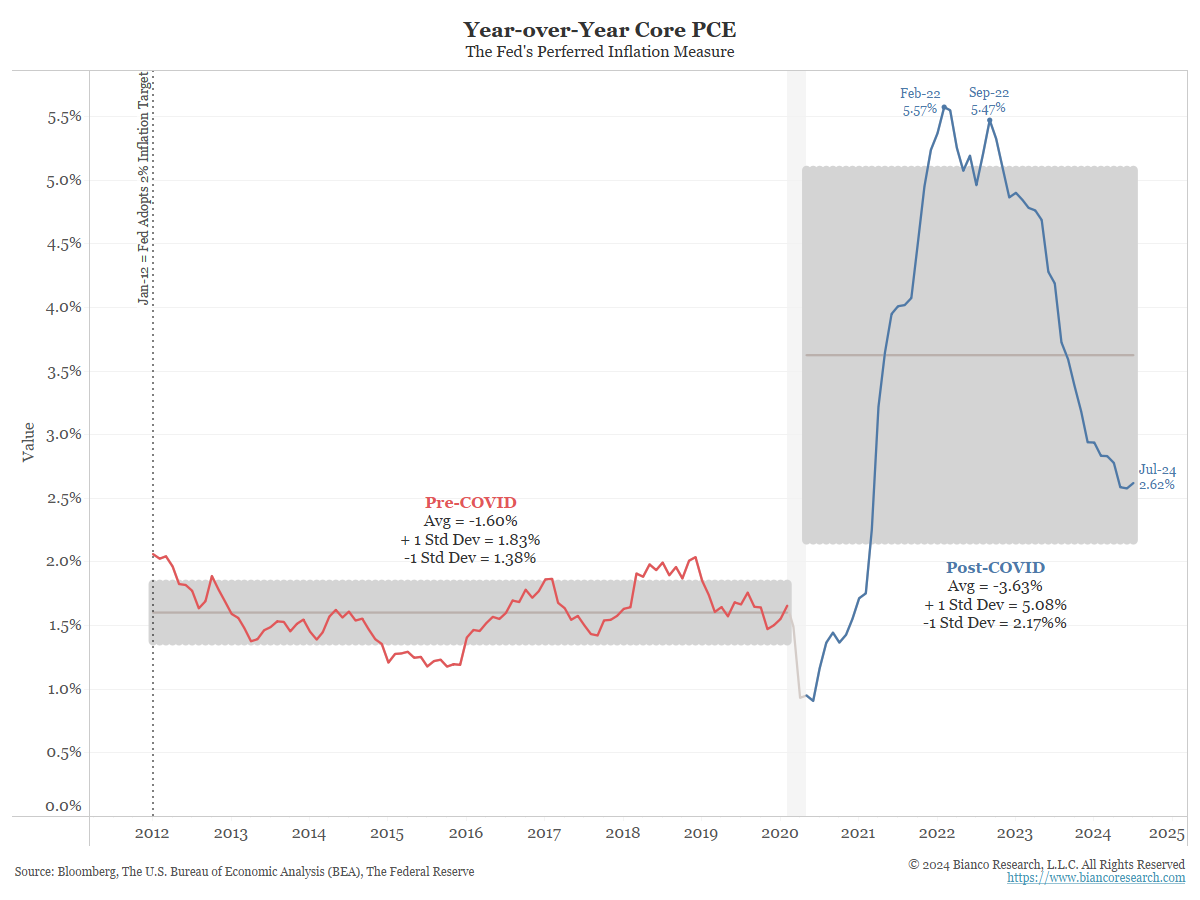
There is an argument that inflation is returning to its pre-pandemic level. Again, using the Fed’s favorite measure, core PCE, an argument can be made that it is not.
In January 2012, the Fed adopted its 2% inflation target. As the red part of the line above shows, rates indeed remained in the neighborhood of 2%. From 2012 to February 2020 (the beginning of the Covid recession), year-over-year core PCE averaged 1.6%, with a one-standard-deviation range between 1.38% and 1.83%. In this period, it certainly looked like inflation was contained.
However, starting in the post-COVID recovery period in April 2020, core PCE has averaged 3.63% with a one-standard deviation range of 2.17% to 5.08%. By the Fed’s standards, this is unacceptable.
Yet the argument is that inflation is defeated. Why?
Clearly, inflation has come down lately, ending the 12 months through July at 2.62%. This can be seen above. But just because a series is going down does not mean the next set of plots will continue in the same direction.
More likely, the reason economists think inflation is defeated is shown below. The black line shows year-over-year core PCE. The various colored lines are the median forecasts for the next seven quarters taken from a Bloomberg survey of about 70 economists.
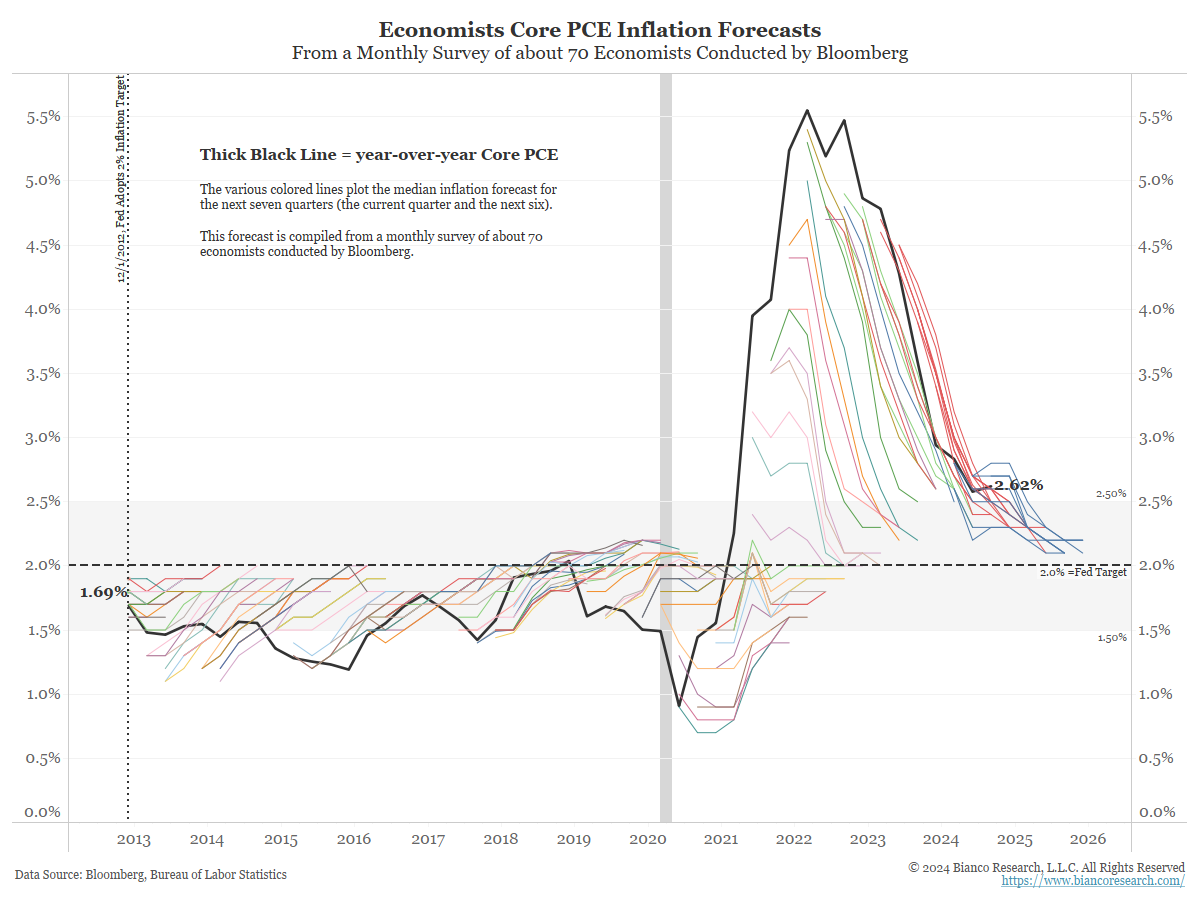
The horizontal shaded area is the Fed’s inflation target of 2% +/- 50-basis points. Economists have been unwavering in believing this is the long-run inflation target. However, note inflation never got back to 2.0% before 2020 and has not come close to returning to 2.0% since 2020, even though respondents continue to forecast as much.
You are only as good as your weakest assumption, and economists’ weakest assumption might be this 2% long-run inflation rate.
The Economy Is Slowing
The chart below shows responses from a Survey of Professional Forecasters conducted by the Philadelphia Federal Reserve. Forecasters were asked to estimate the probability of negative GDP over the next four quarters. The line shows the average of all forecasters (around 100).
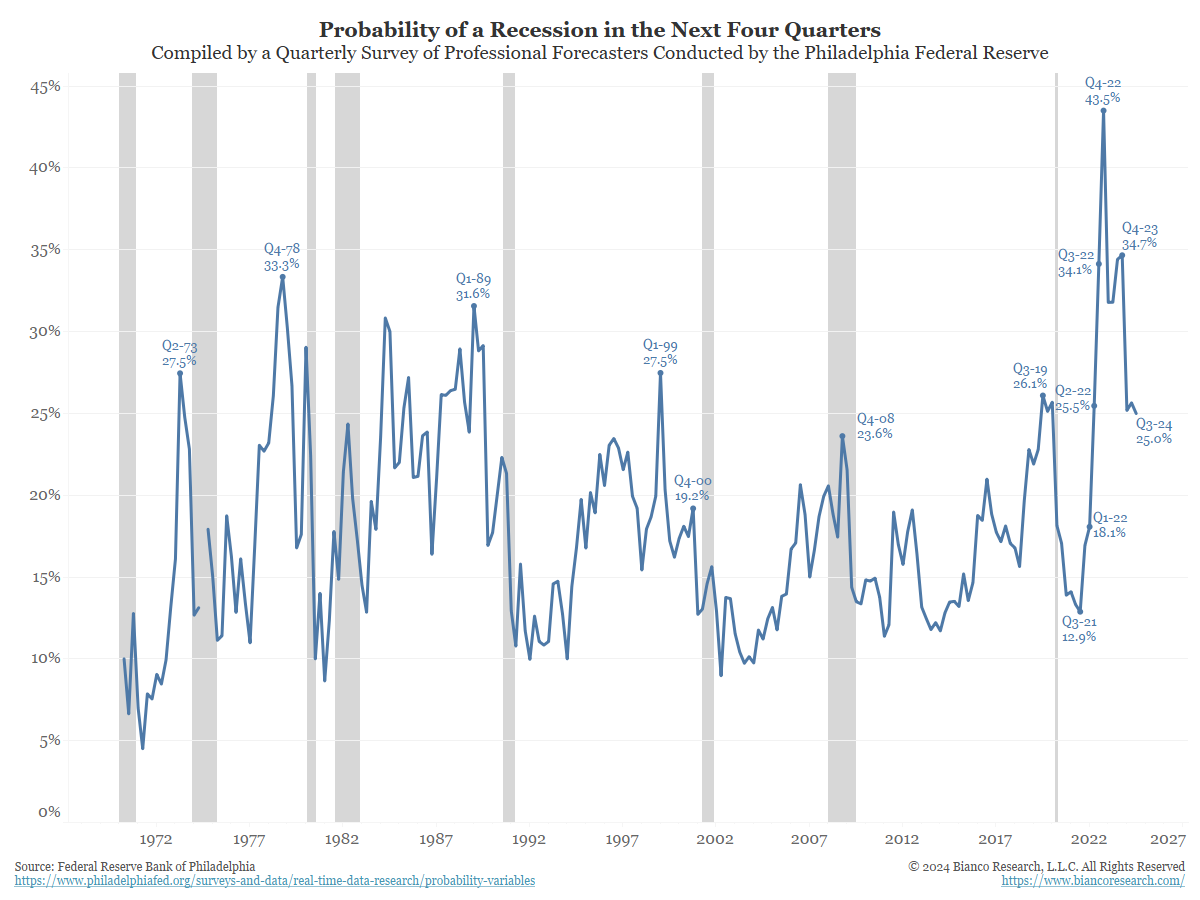
In Q4 2022, the forecasters assigned a 43.5% probability that GDP would turn lower in 2023, the highest percentage in over 50 years of the survey. Not only did the economy avoid a recession, but 2023 was a year of robust growth.
This chart illustrates the belief that the U.S. economy is weak and shows signs of a recession. Even the current probability of 25% is higher than the readings right before a recession began.
The following chart shows real quarterly GDP growth back to 2020. The gray band is what economists call potential growth. This is their estimate of the economy’s growth if it is neither stimulated nor restrained. It is estimated to be between 2% and 2.5%.
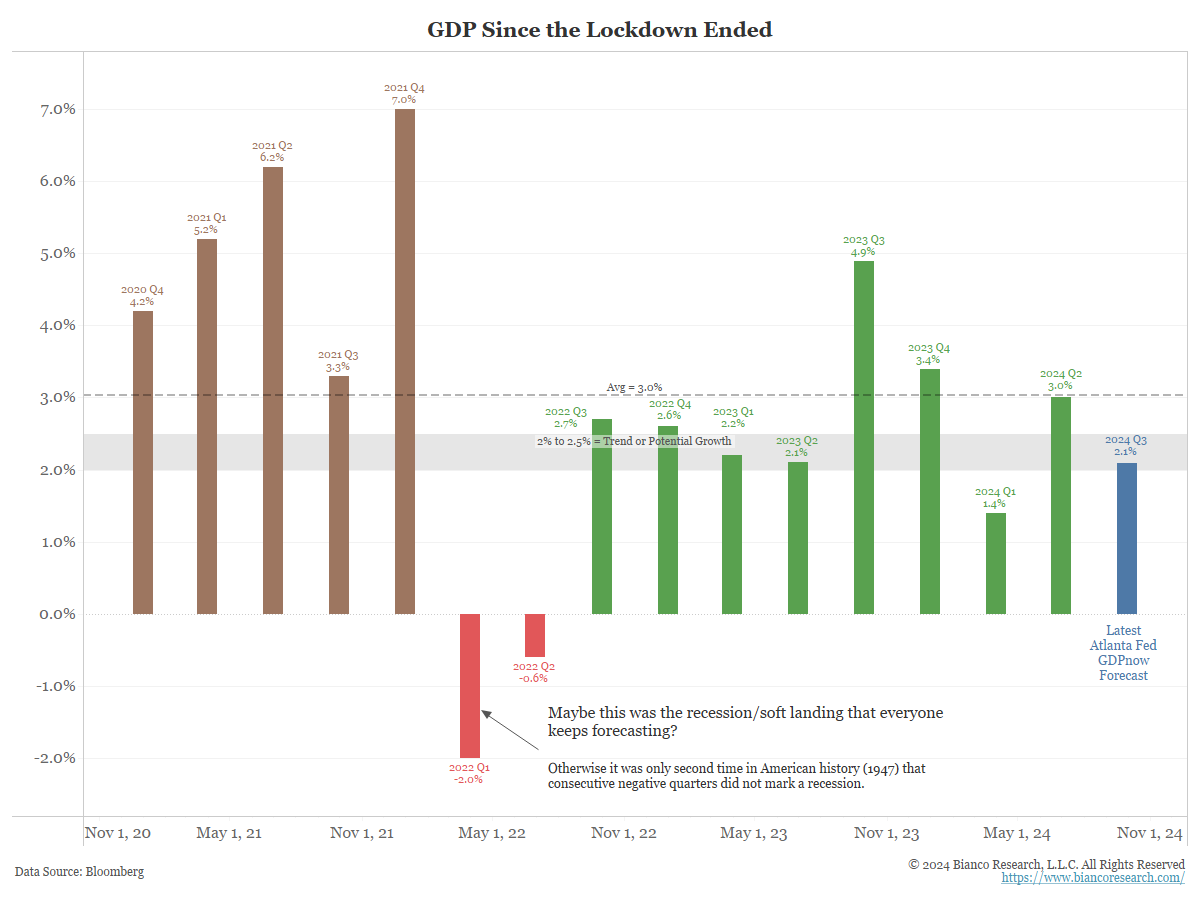
Combining the brown bars (before 2022) and the green bars (starting in Q3 2022), 10 of these 13 quarters saw growth above the potential of 2.5%. This period also saw two negative quarters in Q1 and Q2 2022 (red bars). This happened when the Fed aggressively hiked rates by hundreds of basis points, and the stock market corrected by 25%.
Strong consumption has been a big driver of this growth.
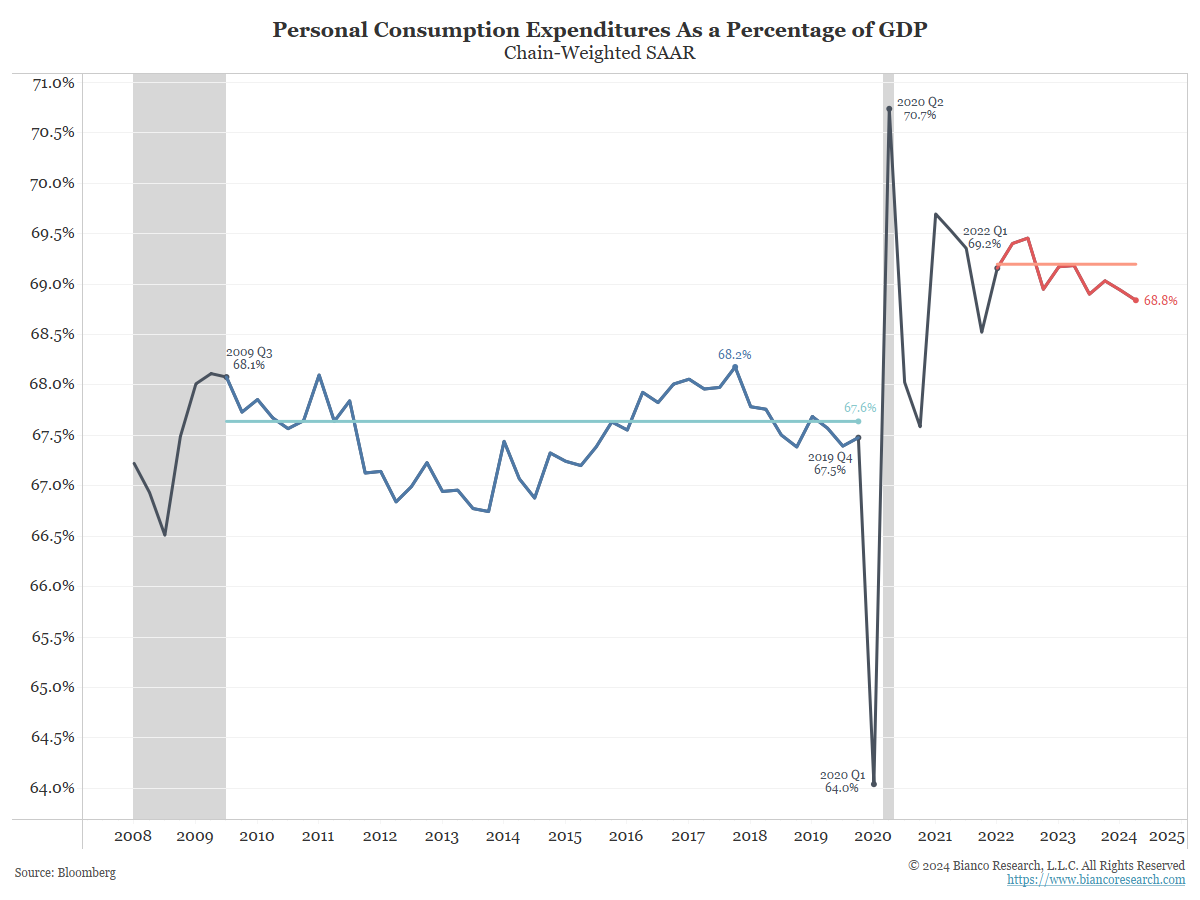
The following chart shows pre-pandemic consumption (blue) averaged 67.6% of GDP. Since the 2022 full reopening (red), consumption has averaged 69.2% of GDP. The lower savings rate drove more consumption and higher retail sales.
This measure is “chain-weighted,” meaning it is after inflation. So, this spending is not due to higher prices from more inflation. Instead, consumers have been buying more units of goods and services.
Unemployment Is Rising
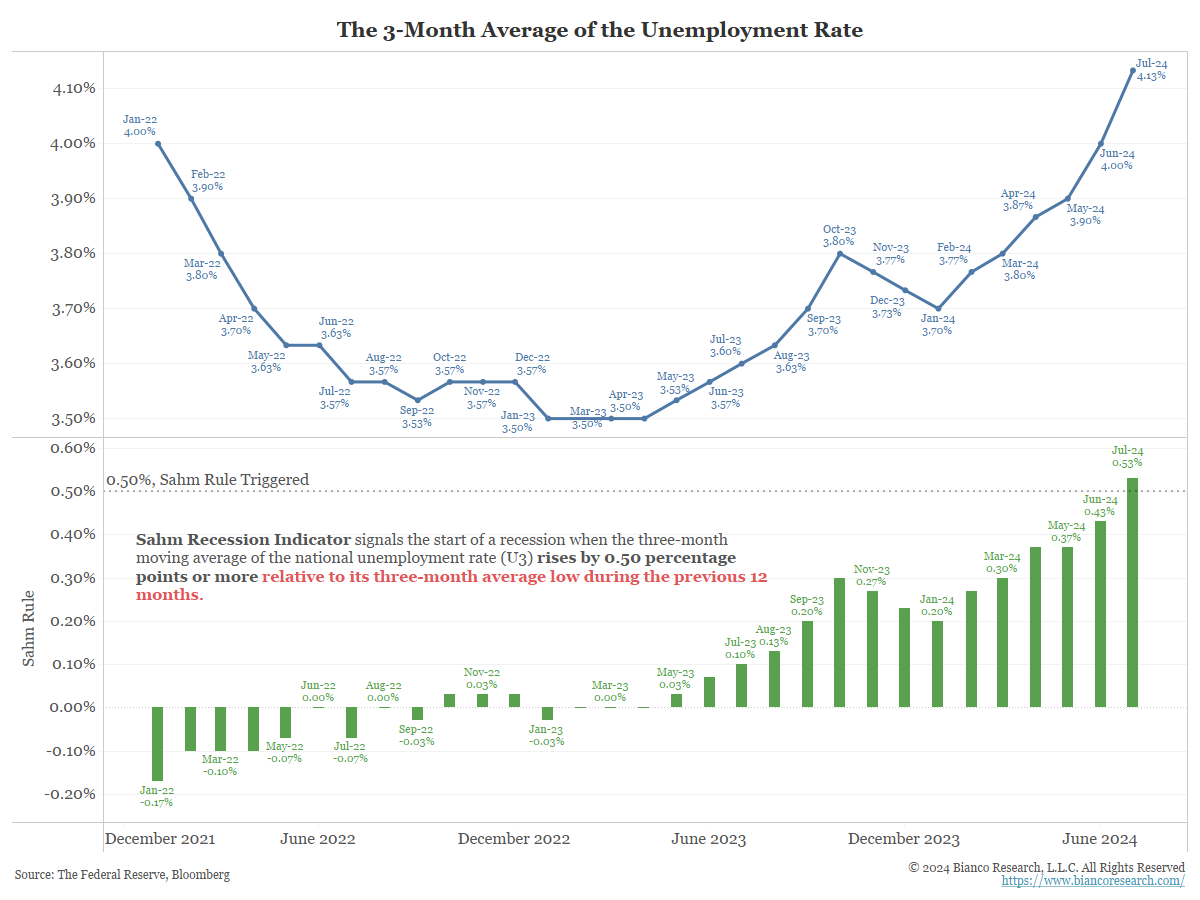
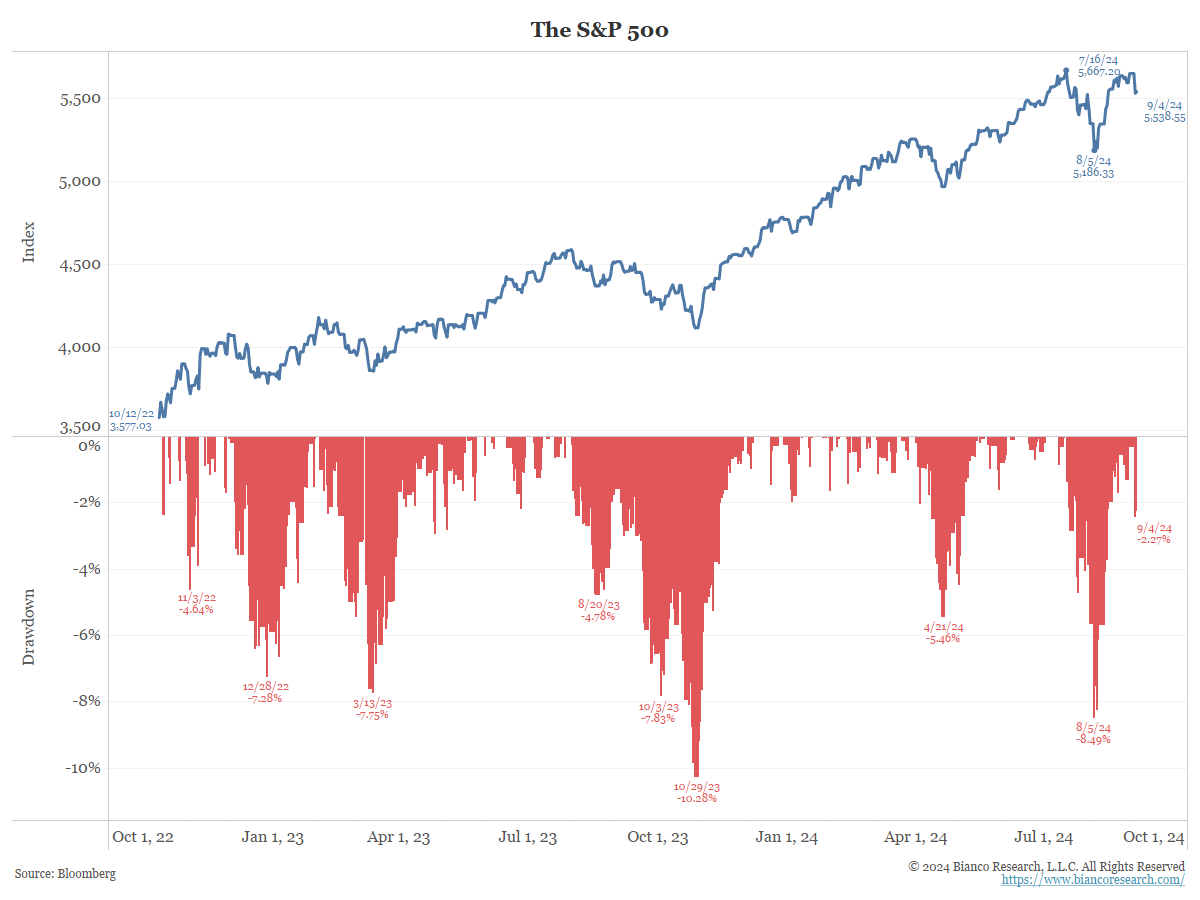
The Stock Market Is Struggling
This section will be simple. Is the stock market struggling? See the bottom panel. Is a 2.5% correction from the all-time high a struggling stock market?
Given All This, How Should One Position?
The following chart shows the bond market has run well in recent months. The 30-year yield has declined about 80 basis points since late April.
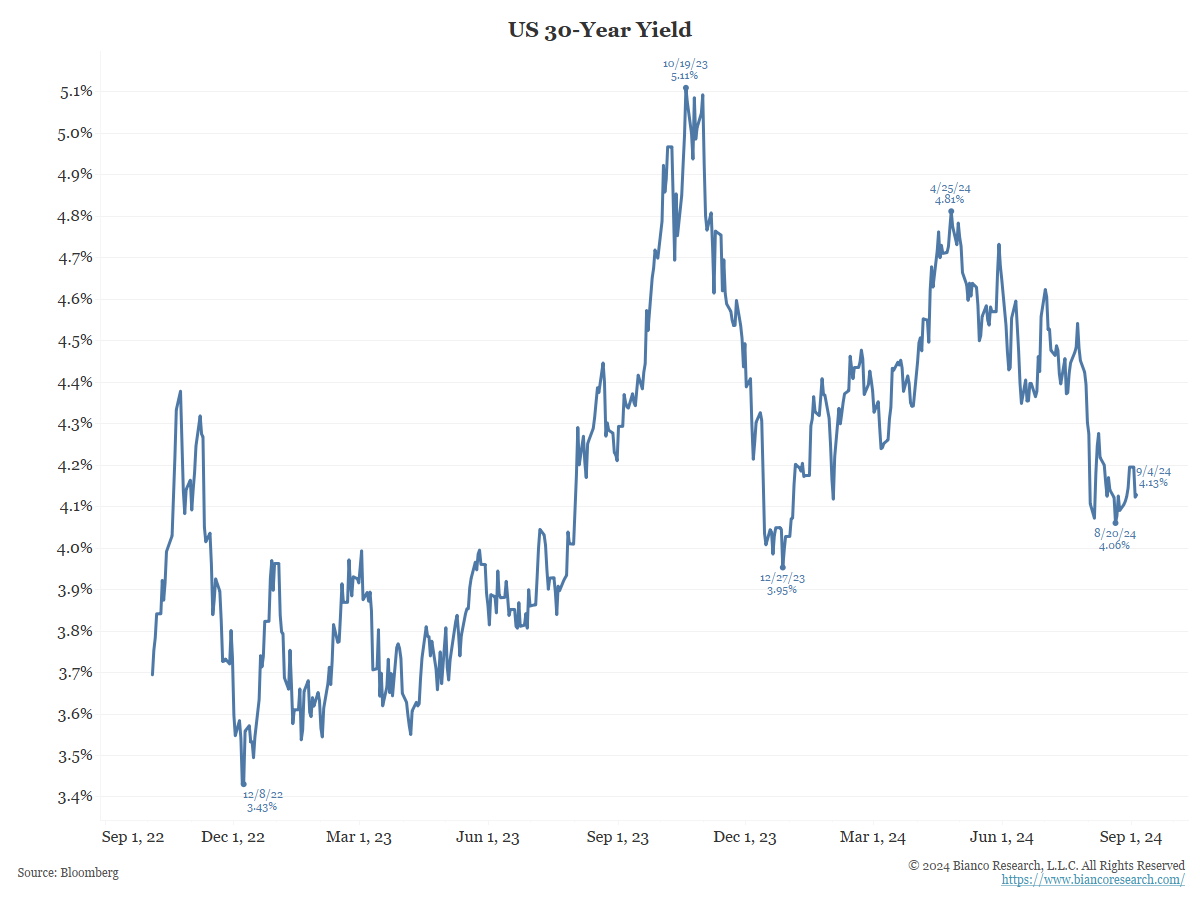
Despite all the bullish bullets pointed out above, yields are still well above their late December low. In other words, a higher low keeps the larger trend pointing up.
We think this is because of the details above. The economy might be doing better than believed, inflation is “stickier” above 2%, and stock weakness is not as bad as feared.
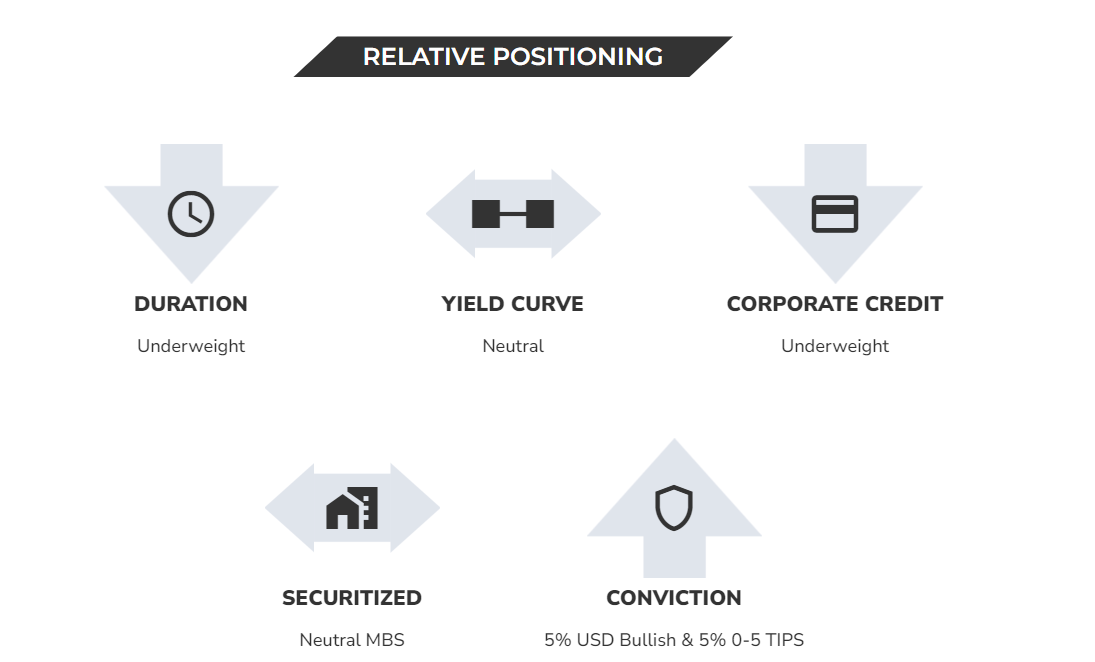
Consequently, as detailed in our September positioning update, we remain defensive, looking for higher yields.
The Year So Far
Bianco Advisors manages the Bianco Research Total Return Index. We manage the index’s “tilts” to outperform broad-based investment-grade fixed-income benchmarks.
Through the end of August, our index (blue) has outperformed both cash (red) and the Bloomberg Aggregate Index (orange).
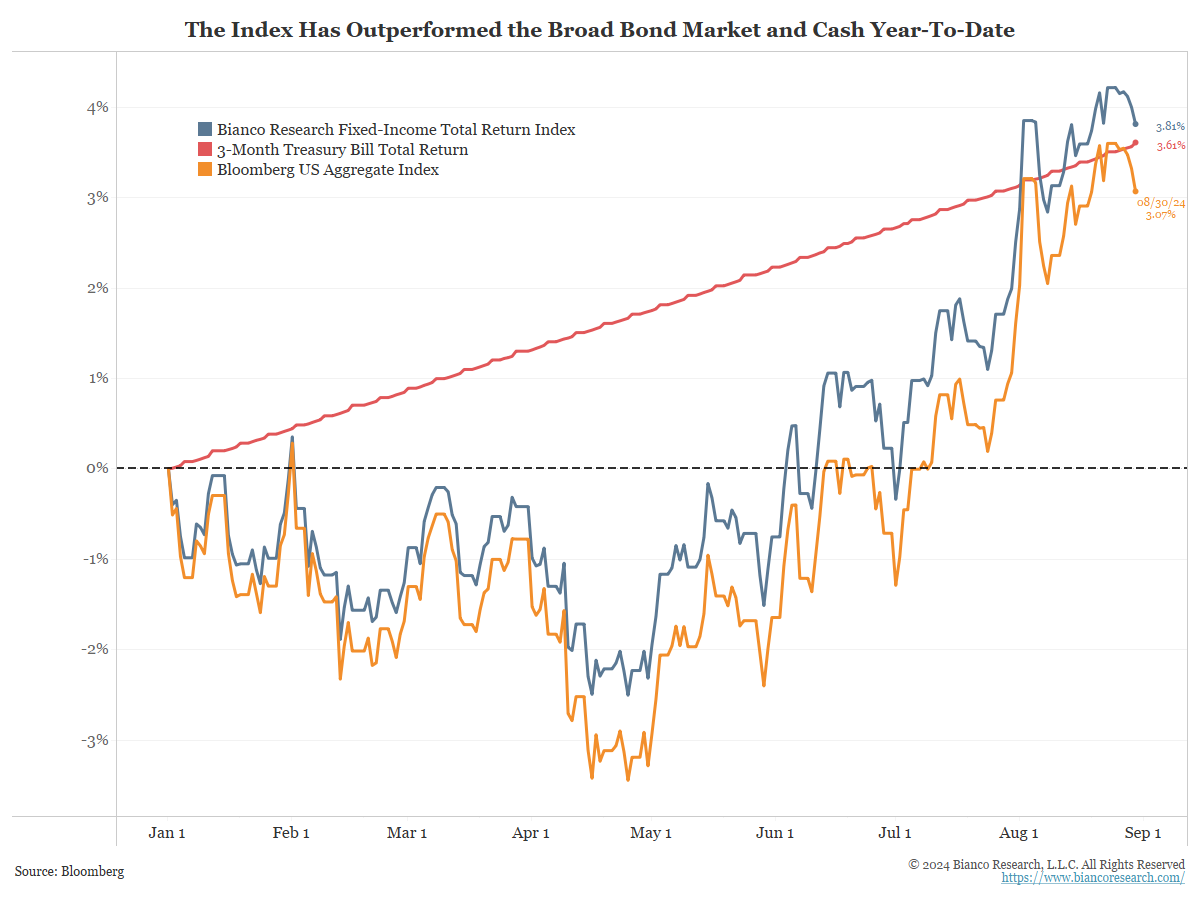
The WisdomTree Bianco Fund (symbol: WTBN) tracks our index. It has shown a similar performance to the index returns above.
Given our details above, we believe positioning for higher interest rates is the best strategy going into 2025.